Resources
Fresh perspectives on reducing work friction and improving employee experiences. Research, case studies, and insights on how FOUNT helps transform workflows.
.webp)

To Create New Value, GBS Leaders Need Different Data
Today’s most ambitious GBS leaders are redefining their mandate. It’s no longer just about delivering services efficiently – it’s about creating new value across the enterprise.
That shift changes everything:
- How success is defined
- How functions partner across silos
- And especially, what data leaders rely on to steer change
But here’s the problem: the data GBS teams use hasn’t caught up.
Most still depend on lagging, siloed metrics – SLAs, ticket volumes, system usage, post-implementation surveys. These show symptoms, not root causes. They track when things go wrong, but not why.
Worse, every function owns its own slice:
HR tracks policy use. IT tracks uptime. Ops tracks workflows.
But no one owns the full experience.
This fragmented view creates friction – not just for employees, but for transformation itself.
The Real Cost of Bad Data? Lost Trust.
Executives want GBS to act like a value engine. But when leaders can’t explain why tools aren’t adopted, or why processes stall, confidence erodes.
You see it play out:
- New digital tools quietly fail
- Employees revert to manual workarounds
- Transformation timelines stretch, and rework creeps in
And yet, GBS has the scope to solve this. It cuts across IT, HR, Finance, and Ops. It sees the end-to-end work.
What’s missing isn’t ambition – it’s a shared, reliable way to measure what’s broken.
You Can’t Create Value Without Seeing the Friction
Most traditional metrics are echoes. They tell you something happened – but not where or why. Like hearing a car crash but not knowing what caused it.
To truly lead transformation, GBS needs leading indicators: data that shows where work is breaking before it affects KPIs.
That means measuring how employees experience the work:
- Where do they get stuck?
- Which tools or processes cause delays?
- How much time is wasted?
- Where do they give up entirely?
This is what friction data reveals.
What Is Friction Data?
Friction data measures the hidden obstacles that slow employees down – across every touchpoint: tools, policies, approvals, and people.
FOUNT’s structured friction data model captures:
- Work Moments (e.g., submit vendor request, plan leave)
- Touchpoints (e.g., systems, policies, support channels)
- Impact (e.g., time spent, frustration, abandonment)
It shows which work experiences cause the most pain – and how that pain is distributed across tenure, region, role, and business unit.
And because it cuts across functional silos, it gives HR, IT, Ops, and Finance a shared view of what’s broken and how to fix it.
Example: Fixing GBS Without the Rework
One global GBS org rolled out a new procurement workflow. Adoption looked good – until tickets spiked and employees reverted to spreadsheets.
SLAs were met. Usage was logged. But employees were stuck.
Friction data revealed:
- 35% found the approval logic confusing
- 42% didn’t know where to go with questions
- The total time to complete the process averaged 3x longer than expected
None of this showed up in their existing dashboards. But friction data made it visible – and fixable – across functions.
This Is Bigger Than Experience. It’s Value Creation.
Removing friction doesn’t just improve service. It:
- Frees up capacity
- Accelerates adoption
- Reduces rework
- Boosts retention
- Unifies disconnected teams around clear action
That’s what transformation actually looks like.
Why Now
AI, automation, and digital platforms are changing the way employees work. But those investments won’t deliver value if GBS leaders can’t see where they’re failing.
Friction is the leading indicator of whether transformation will stick. And structured friction data is how you see it in time to act.
The Bottom Line
You can’t create new value with old data.
And you can’t lead transformation from inside a silo.
Structured friction data gives GBS leaders the clarity and credibility to act — before adoption stalls, before frustration builds, before rework costs pile up.
That’s how GBS regains the trust of leadership – and earns a new, strategic role in shaping the future of work.
Ready to get to the core of the problems at your organization so you can be the one who identifies solutions? Let’s talk.

Data Deep Dive: The Origins of and Statistical Models Underpinning FOUNT’s Use of Data
Your organization is about to undergo a costly AI transformation. You’re looking for some data-backed insight to guide the deployment and help you reach your ROI targets. And you need to get other leaders on board with your vision for the project. Welcome to FOUNT.
FOUNT is different from traditional employee experience surveys, which tend to question respondents across an entire organization with the goal of learning how they feel about their work. We’re interested instead in getting feedback about how that work functions.
Broad employee experience is certainly worth understanding, of course, but it’s the more specific data that FOUNT is after that can help facilitate something like an AI transformation. In this piece, we’ll explain how our unique statistical model came to be and show how it provides actionable recommendations for overcoming workplace obstacles and helping AI transformations become ROI positive.
What We Gather: Enough Data Points to Identify Moments of Work Friction
FOUNT’s statistical model was initially developed to track an employee’s journey through their lifecycle with an organization. The goal was to determine which work moments mattered the most to the employer’s ability to attract and retain talent; that is, those that had the most impact on Employee Net Promoter Scores (eNPS). To get there, we ask employees work-specific and role-specific questions.
For example, if we’re surveying a call center team, our questions will be aimed directly at the type of work they do every day. How do they prioritize customer calls? Where do they seek out the information they need to answer various questions? How do the technologies, processes, and people involved impact that work? What issues do they run into in trying to complete their tasks?
What these data points end up measuring – and what constitutes the focus of the FOUNT approach – is work friction. By isolating the moments in employees’ work days that slow them down or cause them trouble, we’re moving past general feelings about work and drilling down into role-specific issues.
This targeted approach means we don’t need the huge volume of general responses that other employee surveys demand. Our surveys gather data related to specific tasks and roles within an organization – and therefore from a much smaller pool of respondents. In fact, FOUNT can find statistical relevance in a sample size of as little as 53 responses on any given moment (though we often take more into account).
How We Parse It: Data Analysis that Measures Satisfaction and Impact
Fewer responses doesn’t mean less insight – in fact, just the opposite. FOUNT isn’t trying to determine how most or all employees feel about their work. We’re looking for insights into what is and isn’t working within their specific tasks.
We get to that by asking role-related questions about those tasks, with workers providing a grade (on a five-point scale) of how satisfied they are with each of those moments. In this way, we’re actually measuring work itself through a first-person lens to determine which specific employee moments are most relevant and most impactful.
For example, an HR professional may have to terminate employees from time to time. Not surprisingly, this unpleasant responsibility would likely earn low satisfaction ratings. On the other hand, however, they’re probably not going to quit because of it – it’s just part of the job. There’s a distinction between the satisfaction (low) and the impact (low) of the task.
This method can provide more nuance as well. For example, we surveyed a team of software developers on their interaction with a new generative AI tool across several daily work activities. The results showed that the more experienced developers had high ratings for the tool, while the more junior team members reported much lower satisfaction.
In this case, that data divide didn’t just reveal how workers felt about the tool – it offered a potential way to make it more useful for the team. Instead of scrapping the project based on negative feedback from the less-experienced developers, the firm instead provided additional training to this group. The result was a retooled rollout that saved the investment and resulted in more than $5 million in annual cost savings.
This success story, and many others like it, demonstrate a key attribute of our approach – it doesn’t require full unanimity to diagnose any given work obstacle. Instead, we’re after a statistically relevant consensus among a targeted group of employees.
How it Helps You: Clear Insight into Problem Areas so You Can Adjust
Getting clear data on what’s working and what’s not shows an organization which specific problems need the most urgent attention so it can better know where to focus its efforts. This is why work friction analysis is particularly helpful in AI transformations:
- Focus: Work friction data can help single out where in the organization an AI tool should best be deployed or how it can be reconfigured to increase productivity.
- Adjust: Ongoing analysis of that data can provide insight into how an AI rollout is performing – that is, how employees are adopting and interacting with the tool – which an organization can use to make adjustments, if needed.
Any AI project is going to bring with it the kind of significant costs and pressure that demand confident, data-backed decisions. Work friction analysis delivers actionable insights to fuel exactly those kinds of decisions.
The Power of Decision-Ready Insights
Traditional employee experience surveys can help you understand how employees feel about their work. But they don’t assess the actual work those employees do and where they specifically encounter problems. Work friction is next-level employee data that focuses on the actual work being done – which is where AI deployments live.
Getting to decision-ready insights is all about the how: By understanding how employees work – rather than just how they feel about that work – organizations can understand how AI can address the issues they’re having. So, when the decision-makers in your company want to know why you’re using work friction data to guide your AI project, you can explain just how important it is to success.
Get in touch to learn more.
LIVE Webinar – July 9th for SSON Network. Beyond AI Hype: How to De-Risk Your GBS Transformation with Friction Data
LIVE Webinar | July 9th | 10 AM EDT
Today, ambitious GBS leaders are expanding the way they define transformative business value. Whilst their goals are growing, the data they use to de-risk their transformation hasn’t changed much.
This webinar will spotlight how GBS leaders are fixing a bigger problem: the way they measure work.
Process Mining, SLAs, and ticketing systems only tell what happens after something goes wrong. They don’t show how to prevent problems before they start.
In this session, you’ll hear real stories from leading GBS teams using a new kind of data – called friction data – to find and fix what slows workers down and leads them to reject new digital and AI-powered GBS tools.
In this session, you’ll hear how GBS teams are using friction data to:
✔ Accelerate AI and digital tool adoption
✔ Bridge silos and unify service delivery
✔ Free up to 2 hours of productive time per worker, per day
What You’ll Learn:
- Why friction data is a leading indicator for successful digital and AI adoption
- How to apply a proven framework to proactively measure day-to-day friction
- How a unified friction data model creates better GBS experiences across HR, Finance, Procurement, and IT

Speakers
Christophe Martel
CEO and Co-Founder, FOUNT Global
Christophe Martel is the co-founder and CEO of FOUNT, a SaaS platform that helps companies identify and remove work friction. He has 30 years of experience helping organizations improve the way their people work. He was formerly Chief Human Resources Officer at talent management and employee experience consulting firm CEB, which sold to Gartner for $2.7 billion in 2017.
Stephanie Denino
Director of Applied EX practice, TI People
Stephanie Denino is the Director of Applied EX practice at TI People – an employee experience consultancy (EX). Stephanie works with leaders who are eager to shape and apply the practices that will allow them to systemically improve experiences for and with their people.
Lucy Hughes
Senior Vice President, Head Global HR Operations and Shared Services, PepsiCo
Lucy Hughes is a strategic HR executive at PepsiCo with deep expertise in HR services, systems, and global shared services. She brings extensive experience in talent management, organizational development, and transformation, consistently leading complex, outcome-driven projects. Known for driving sustainable performance and large-scale change, Lucy excels in identifying key challenges and delivering impactful, results-focused solutions.

Case Study: $5.4M in Annual Savings by Leveraging GenAI Tools and Removing Work Friction
The Challenge
Gamma Financial, a Fortune 500 financial services company with 1,000 developers, faced the following challenges in its digital transformation:
- Low Adoption of GenAI Tools: While AI chatbots and code assistants were implemented to optimize workflows, adoption rates were uneven and lower than expected.
- Friction in Daily Tasks: Developers struggled with two key areas:
- Finding Answers About the Codebase: Developers spent 4+ hours weekly searching for accurate information, hindered by an outdated Developer Portal and underutilized AI Chatbot.
- Reviewing Pull Requests: This process was time-intensive, with junior developers heavily relying on senior team members.
- Proving ROI: Leadership needed clear data on the ROI of GenAI tools to justify their continued investment.
The Solution
Gamma Financial partnered with FOUNT to pinpoint and address the sources of work friction. The solution involved:
- Targeted Surveys: FOUNT deployed micro-surveys among 450 developers to measure satisfaction, effort, and time spent on key tasks involving GenAI tools.
- Dashboard Analysis: FOUNT’s comprehensive dashboard identified the most critical friction points, such as challenges with the AI Chatbot and Developer Portal.
- Actionable Improvements: Key steps included:
- Automating code documentation updates to improve the Developer Portal and AI Chatbot usability.
- Encouraging the use of AI Code Assistants for static code analysis to streamline pull request reviews.
The Results
Gamma Financial’s targeted approach delivered the following outcomes:
- $5.4M in Annual Savings: Developers saved an average of 3 hours per week, translating to 120,000 hours annually across 1,000 developers.
- Improved Tool Satisfaction:
- Developer Portal: Satisfaction scores increased from 33% to 60%.
- AI Chatbot: Satisfaction scores rose from 42% to 65%.
- Enhanced Workflow Satisfaction:
- Finding answers about the codebase: Satisfaction improved from 55% to 72%.
- Reviewing pull requests: Satisfaction increased from 63% to 71%.
These improvements not only saved costs but also empowered developers to maximize the potential of GenAI tools, strengthening Gamma’s digital transformation initiatives.
Download the Case Study
AI Transformation Playbook: The Definitive Guide to Measuring, Rescuing, Prioritizing, and Scaling AI Transformations
AI is impossible to ignore right now. But despite ever-increasing adoption, only four percent of companies are able to consistently generate value from their AI investments. Some of that’s because the technologies most orgs are experimenting with are so new.
But a lot of it is because most organizations don’t have the knowledge or tools to gather leading indicators of AI success.
In this playbook, we’ll lay out everything you need to know to measure the effectiveness of your AI implementations so you can rescue failing tools, prioritize future projects, and scale successful investments.
Follow these recommendations, and you’ll be able to achieve your transformation objectives faster and with less risk to the business.
Table of contents
- Frameworks for AI Transformations
- How to Measure AI Transformations: 5 Keys to staying ROI Positive
- Data Frameworks: How Surveys About Work Let You Achieve Transformation Goals Faster
- How to Rescue ROI-Negative AI Implementations
- How to Prioritize Future AI Investments
- How to Scale Future AI Investments
Frameworks for AI Transformations
Before we get into the hands-on tactics for making the most of your AI investments, let’s clarify what we mean by “AI transformations.” Broadly, we’re talking about digital transformations that involve an organization bringing in some third-party AI tool or software to improve operations.
In practice, we’ve found that these transformations tend to fall into one of three buckets:
Transformation TypeHow it WorksExampleInternal services transformationImplementing AI tools that help employees navigate company services (HR, IT, etc.)A global organization streamlines enterprise services with AI-powered tools and saves $2.3 million annuallyEmployee work tool transformationImplementing AI tools that employees use to do their jobs (chatbots, copilots, etc.)A financial services company deploys an AI chatbot to increase developer efficiency and saves $5.4 million annuallyCustomer-facing transformationDeploying AI solutions in customer-facing functions (chatbots, etc.)An insurance provider deploys a self-service AI chatbot to speed up the claims process.
Regardless of the type, AI transformations are different from other digital transformations in one important way: they are bottom-up rather than top-down. To succeed, they require individual employees across your organization to use them on a regular basis.
This means they have to make work easier. If a new AI tool doesn’t make work easier, employees will not use it and the ROI of the transformation will be negative.
Luckily, there’s a way to overcome this problem, and it involves a key concept in maintaining positive ROI in AI transformations: work friction.

To measure work friction, you have to look at specific work moments (aka specific tasks employees do during the day) and the touchpoints involved in each moment. Touchpoints include things like people and technology required to get the work done.
Much of the rest of this playbook focuses on how to identify work friction in and around AI tools. When you do that regularly, you’ll have the information you need to remove obstacles, improve productivity, and improve the ROI of all your AI transformations.
How to Measure AI Transformations: 5 Keys to Staying ROI Positive
Summary:
- Measure leading indicators of ROI
- Identify problem areas
- Identify problem causes
- Address problems
- Re-measure
The problem many organizations face when measuring the ROI of AI transformations is that they’re only able to gather data on lagging indicators of success – things like…
- Decreased reliance on support teams (and lower support costs).
- Reduced employee time spent on tasks (and increased productivity).
- Stable or improved employee experience.
And when you have to wait for lagging indicators, it’s often too late to make changes to things that aren’t working.
To stay ahead of the ROI question, organizations need a way to measure leading indicators of AI transformation success. This means measuring the work itself – and the friction present in that work.
Leading indicators are things like…
- Relevance of work required to complete tasks.
- Effort required to complete tasks.
- Time required to complete tasks.
- Enjoyability of tasks.
To measure this, you have to run surveys that ask employees about what happens during specific work moments as they work with various touchpoints. In Figure 1, you’ll see what this looks like in FOUNT’s interface. (For more on how our data models work, jump to the next section.)
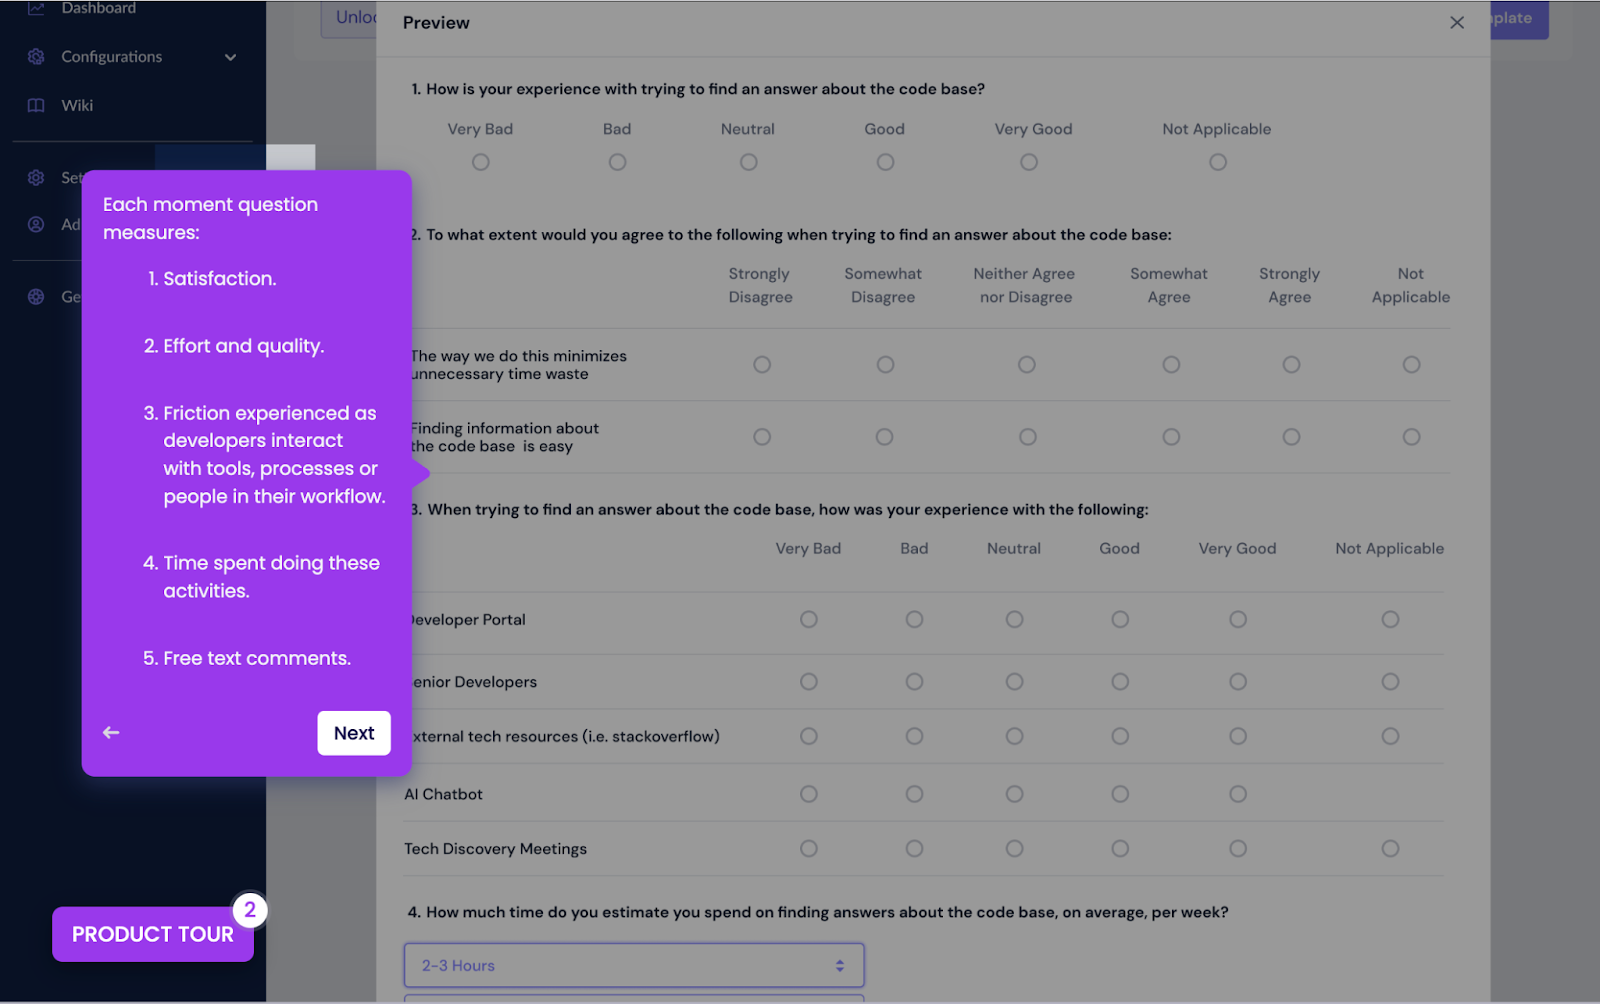
Figure 1: Example survey questions asking about moments and touchpoints
Work moments for a developer might include, for example, writing code, debugging code, writing documentation, finding an answer about the code base, reviewing pull requests, and so on. Touchpoints might include things like the developer portal, senior developers, external tech resources, an AI chatbot, etc.
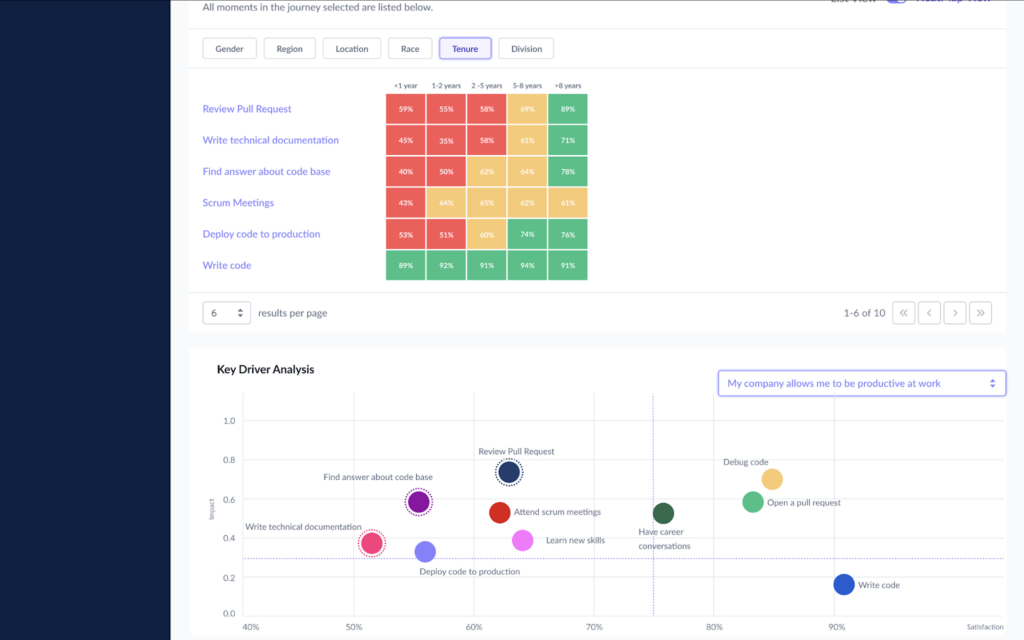
Once you’ve collected this data, it’s time to identify problem areas. You can do this by plotting the importance of a moment against its impact on work overall (Figure 2).

Figure 2: A visualization of moments, plotted by importance to overall work vs. employee satisfaction
Moments that are of high importance that have low satisfaction numbers are problem areas. This is where your work friction exists!
If, during an AI transformation, anything related to your AI tool is generating work friction, the transformation is at risk for negative (or less-than-projected) ROI. As soon as you know this information, you can take steps to reduce the work friction and get the project back on track.
To identify what’s causing problems, look to the free-form answers from the survey (Figure 3).

Figure 3: Free-form survey answers and sentiment analysis
You can then estimate the ROI of addressing each problem (Figure 4).
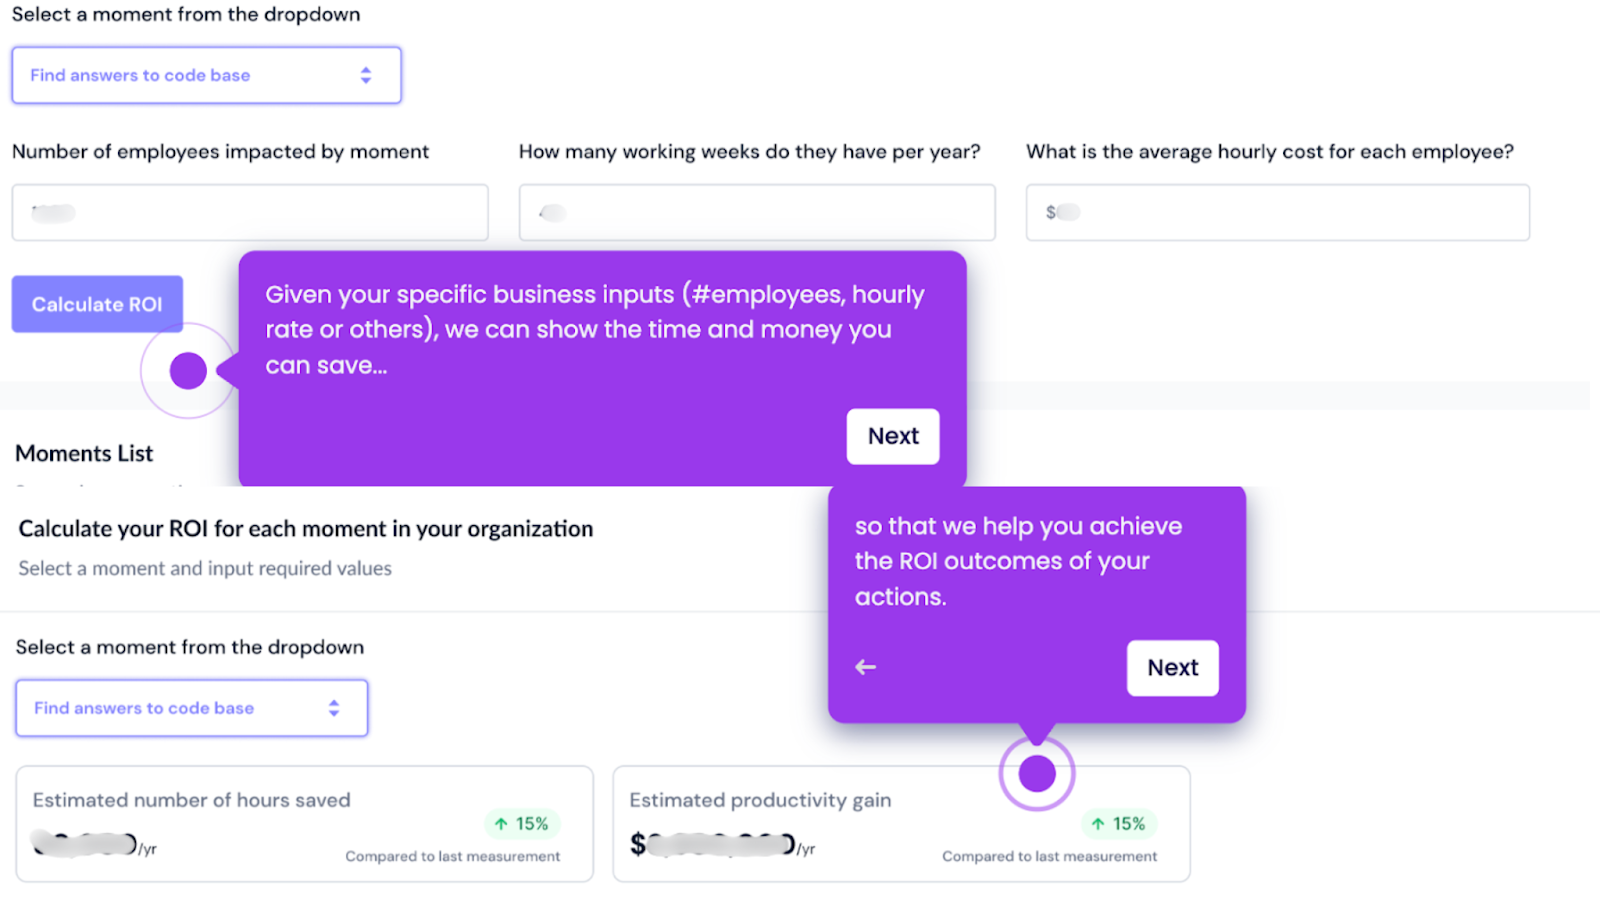
Figure 4: Our process for calculating potential ROI for fixing problem areas
Once you have that information, you can develop solutions, implement them, and run the survey again to see if the work friction has resolved.
One thing to keep in mind: once you introduce AI, the nature of your employees’ work will change. Surveying them about their work is important not only to assess whether the solutions you implement work but also to identify new sources of friction that emerge from their changing role.
For more on this, check out How AI Tools Change Your Team’s Work (And What to Do About It).
To summarize: when you measure leading indicators of AI ROI (relevance of work, effort required, time required, enjoyability), you get a sense of ROI early in an implementation, when you still have time to change course.
Now let’s take a look at why these metrics are so powerful and why FOUNT’s system (which we’ve been showing via screenshots) works so well.
Data Frameworks: How Surveys About Work Let You Achieve Transformation Goals Faster
If you read that heading and thought, “The last thing my team needs is more surveys,” stay with us.
First: Traditional employee experience surveys aren’t anchored to key work activities. They may offer valuable high-level insight, but they are rarely actionable when you’re trying to assess the ROI of an AI transformation.
Second: Traditional surveys are long and aim for 100 percent participation.
Third: Most organizations lack a structured framework for when and why surveys are sent. Employees may receive two or three surveys a day – one about submitting a ticket, another about using a tool, a third from a department lead doing their own research. Not only is this disjointed – it’s exhausting. And that’s not just survey fatigue.
Fourth: While survey fatigue is often blamed for disengagement, the deeper issue is a lack of visible action. Even when employee feedback drives decisions behind the scenes, those outcomes are rarely communicated. The result? Employees assume their input doesn’t matter, and engagement drops even further.
How FOUNT’s surveys are different
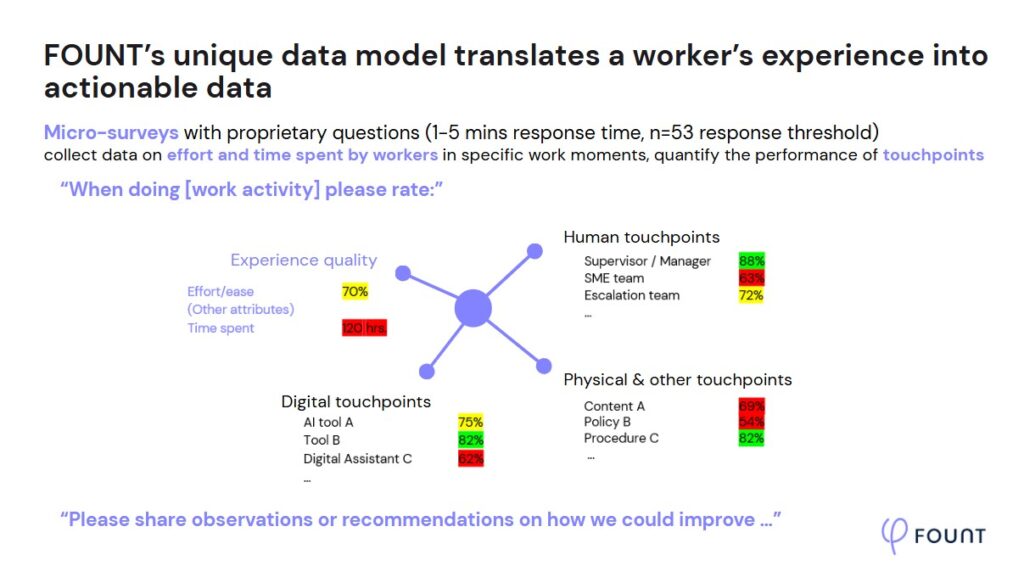
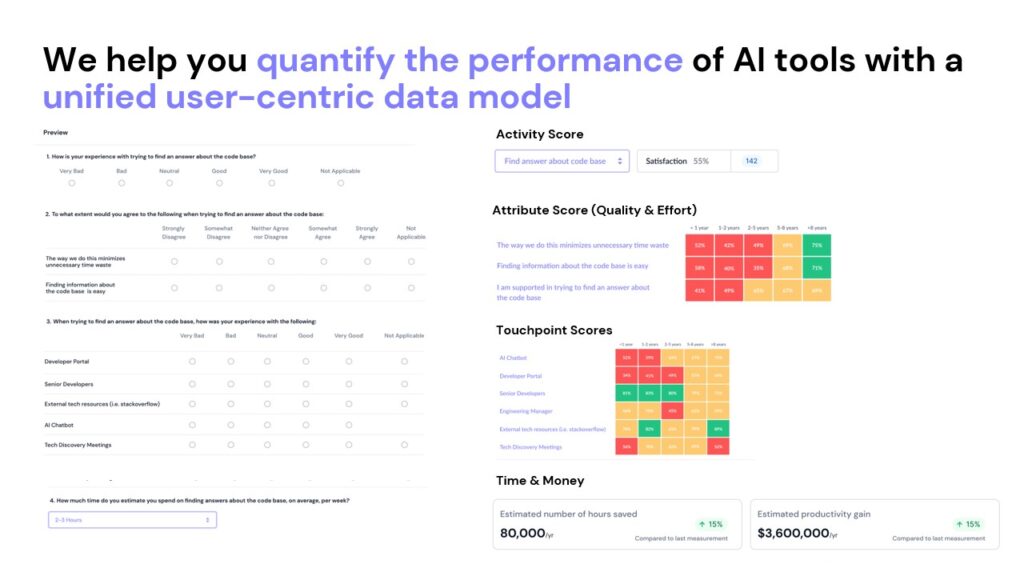
Our surveys (Figure 5) are different from traditional EX surveys in three ways:
- They ask about the work itself: effort, time spent, friction experienced, and satisfaction in the context of real employee tasks.
- They deliver meaningful insights with a small, focused sample. To get statistically significant results, you only have to survey about 53 employees.
- They’re fast to complete – FOUNT surveys take between one and five minutes per person to complete.
And perhaps most importantly: Our model is built for action.
![Graphic with the title "FOUNT's unique data model translates a worker's experience into actionable data. Micro-surveys with proprietary questions (1– 5 mins response time, n=53 response threshold) collect data on effort and time spent by workers in specific work moments, quantify the performance of touchpoints."Below this is a graphic of a hub and spokes. Above this is the phrase "when doing [work activity] please rate:"Each spoke represents something a worker is expected to rate: experience quality, digital touchpoints, human touchpoints, physical and other touchpoints.At the bottom is the prompt for the next question: "Please share observations or recommendations on how we could improve..."](https://cdn.prod.website-files.com/689588da82ec8818d00e020b/68a99d146e4ca42b28b693ab_AD_4nXdf6ghHRv2W9PH-HP7k9ky7RCwx1MZ4hSuH_I9kjR1xGZ50siiswCcl8uj3pTk1IrANiFaGNPloGxr_zWSHHOzEsTTZ5dh1GxnBTP5nAlbUguoBvb_L0hYrek4HrgHFyLEr6gmWKw.png)
Figure 5: FOUNT’s data model translates worker experience into actionable data
Using actionable data to achieve transformation goals faster
Transformation happens when workers adopt ways of working that make them more productive, efficient, effective, or all three. To reach transformation goals, then, it’s essential to measure the actual work employees are doing.
For more on how FOUNT’s data fuels transformations, check out The Origins of and Statistical Models Behind FOUNT’s Use of Data.
How to Rescue an ROI-Negative AI Transformation
Let’s imagine now that you launched an AI product or tool at some point in the past. When you first checked your lagging indicators, they showed that the project was on its way to being ROI-negative – that is, the numbers showed…
- Increased reliance on support teams (or higher support costs);
- Increased employee time spent on tasks (or decreased productivity); or
- Worsening employee experience.
Don’t worry: it’s not too late to rescue the implementation.
Before we walk through the how-to, though, it’s important to resurface the concept of bottom-up transformations.
AI transformations are bottom-up because their success hinges on individual workers seeing the value in and therefore using AI tools. If workers don’t see the value in these tools, they’ll likely find a way to work around them.
This is terrible for ROI.
Even worse: once workers lose faith in an AI tool, it’s hard to recover that faith. So the sooner you can measure impact and adjust course as needed, the better. If it’s already been several months since the introduction of the unsuccessful AI tool, you’ll need a comms plan to accompany any changes you eventually make.
Now to the good stuff – how to rescue an ROI-negative AI transformation:
- Identify work tasks (aka moments) affected by the AI tool.
- Spin up surveys to assess how the AI tool affects those moments. If you work with FOUNT, you can choose from one of our many templated surveys and then tweak it to fit your team’s needs.
- Distribute the survey to an appropriate selection of workers (often as few as 53).
- Review results to identify areas of work friction (aka those with high importance and low satisfaction) (Figure 6).
- Review freeform text responses to understand the causes of the friction.
- Address the friction.
- Re-survey to determine whether your fix worked.
For example, imagine an organization that introduced a coding copilot to its IT team to improve coding efficiency. When the team lead ran surveys to figure out why the team hadn’t yet reached the anticipated efficiency improvements, they found that three areas had high work friction (aka high importance but low satisfaction) (Figure 6):
- Writing technical documentation
- Reviewing pull requests
- Finding an answer about the code base

Figure 6: Bottom-ranked moments by importance vs. satisfaction
The team lead then considered the comments developers had written in the free-text portion of the survey and discovered that the words “portal” and “chatbot” came up over and over.
When they dug deeper, they found that developers wanted better documentation of internal knowledge in the portal – something that would make the chatbot trained on internal data far more effective.
This aha moment gave the team lead a clear goal for how to improve not only the effectiveness of the AI chatbot but also the overall efficiency of the team. They were able to rethink the portal, improve information sharing, and ultimately save $5.4 million in productivity across the IT team.
How to Prioritize Future AI Investments
Every day, AI leaps forward. New tools hit the market. Models hit new benchmarks. It’s no wonder, then, that 41 percent of CFOs struggle to prioritize AI projects because of uncertainty.
One strategy many business leaders take is to find AI tools for the parts of the business that drive the most revenue – the sales team, for example. While this sounds reasonable at first glance, it often leads to ho-hum results.
Why? Because the purpose of AI is to automate work. It functions best when it removes friction from existing workflows.
If you start from a revenue perspective, you may not choose a tool that addresses existing friction. Because of that, it may not offer much value to users, which means they may not actually use it – and then you’re looking at a negative ROI.
A better way to prioritize future AI investments is to start with friction.
Survey your employees to identify moments of work friction, research tools that can remove it, then repeat (Figure 7).
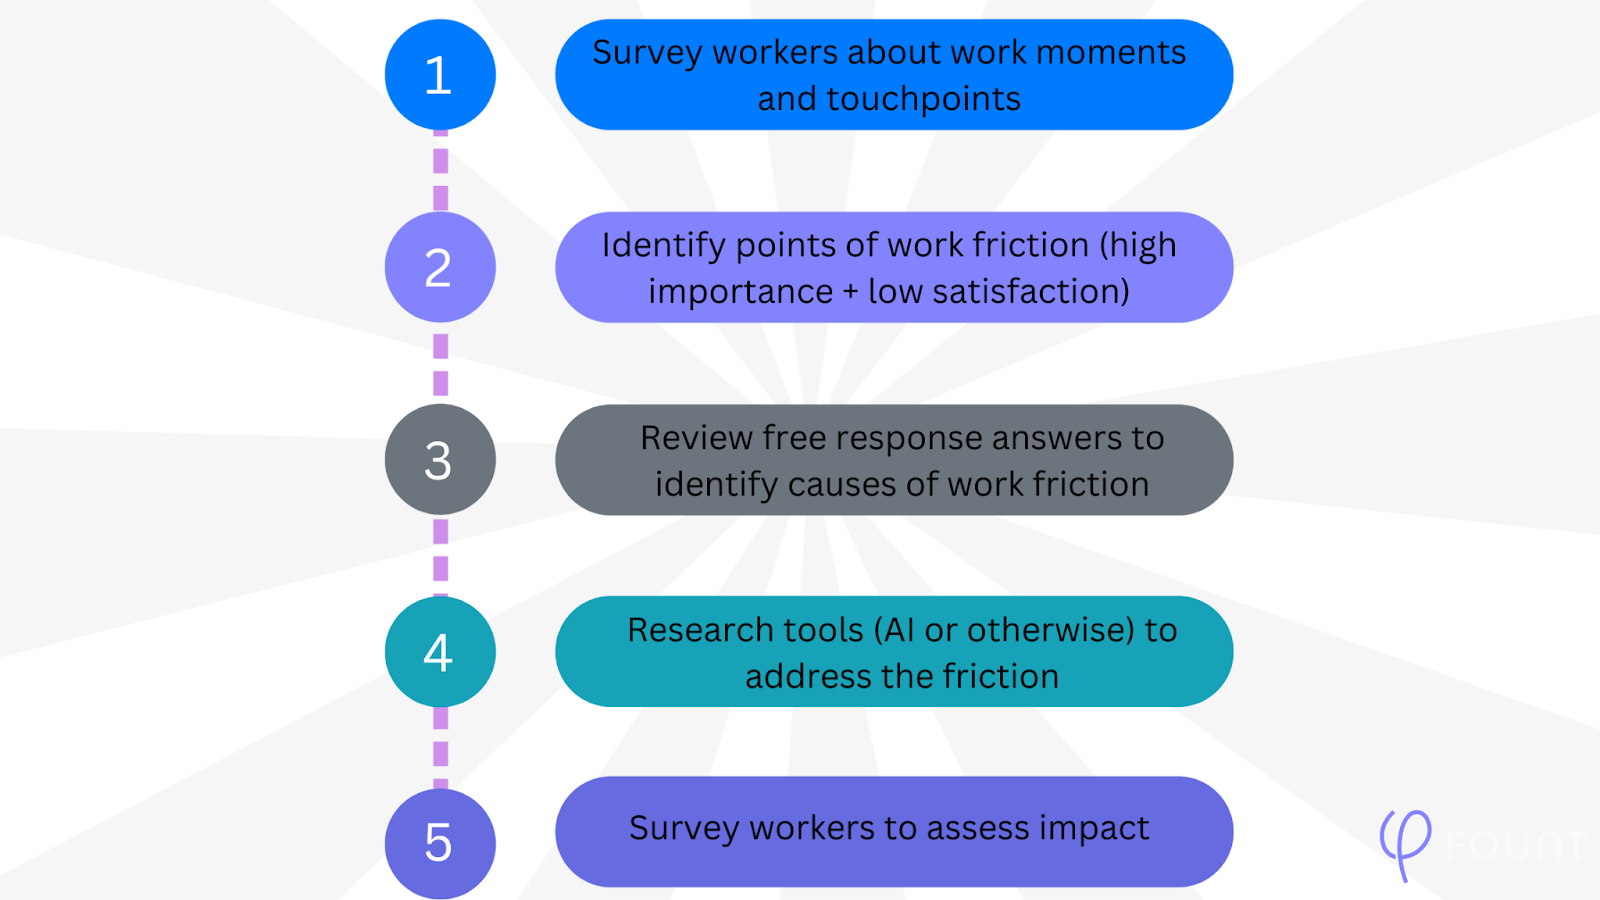
Figure 7: Flowchart of steps for prioritizing future AI projects
Note: In some cases, the best tool for the job won’t be an AI tool. That’s okay. If you position your overall AI strategy as one to improve efficiency and productivity, then it’s natural that identifying where not to use AI is as important as where to use it.
How to Scale AI Transformations
Once you achieve productivity or efficiency increases with an AI tool, your board will no doubt clamor for more across the organization. But AI success can be notoriously difficult to scale.
Why? One reason is that, once you introduce an AI tool, the nature of your employees’ work inevitably changes.
For example, if you introduce an AI chatbot to a call center to handle all straightforward customer questions, the result is that call center employees now handle exclusively complex questions. This means they may need additional training or support. It may mean you need to adjust your recruitment and hiring processes to prioritize workers with different skill sets.
In fact, it may mean a lot of things. This is why it’s important to measure work repeatedly, to understand which areas of friction are being resolved and where new friction points are cropping up.
For example, maybe the AI chatbot is good at most simple queries but bad at anything involving product returns. Those calls always end up escalating to human agents, and by the time the agent is on the line, the customer is frustrated, making the call more challenging.
A work friction survey would uncover this problem right away. You could then reroute return-related calls directly to agents while you adjust the AI chatbot and redeploy it.
If you’re always measuring employees’ work, you’re always seeing new opportunities for AI to improve it. This means you’ll always have a strategy for identifying your next AI deployment – which, across the organization, means you have a plan for scaling AI.
Protect Your AI Investment: Gather Data You Can Act On
AI tools are a major investment: in addition to their cost in dollars and cents, they require organizations to invest in organizational shifts, new ways of working, and even new ways of thinking.
When all that is on the line, a wait-and-see approach is not sufficient. By gathering data about the specific things AI changes, leaders can identify what’s working, adjust what’s not, and therefore keep projects on track to realize budgeted ROI.
Still have questions about your AI transformation? Get in touch – we’d love to help you ensure your current and future AI investments deliver the ROI you planned for.
How to Prioritize AI Use Cases to Maximize ROI
KEY TAKEAWAYS
- Organizations may have hundreds of potential AI use cases. But they don’t know which to choose, mostly because they don’t have any solid data to guide them.
- As a user-driven technology, the success or failure of AI depends largely on whether employees choose to adopt the tool – something they’ll only do if it makes their work easier.
- The key with AI is to pinpoint where it is most likely to help smooth out problem areas, remove obstacles, and accelerate work for employees. Work friction data is the most effective way to discover where those areas and obstacles lie.
The AI dilemma is becoming clear. While 79 percent of leaders say they need to adopt AI to stay competitive, 59 percent aren’t sure how to measure its impact. And those questions tend to stall plans and projects – 41 percent of CFOs say they struggle to prioritize AI amid uncertainty.
It’s a complication that plagues AI adoption for many organizations: they have hundreds of potential AI use cases but don’t know which to choose. Why? Because they don’t have any solid data to guide them.
In reality,the data you need already exists within your organization. It’s called work friction data and it can help you identify the most attractive opportunities. Here’s a look at how.
Rethink How You Deploy AI Tools
Most digital transformations tend to take a classic top-down approach. The organization rolls out a new technology or solution and expects everyone to use it. In most cases, everyone does, often because they have no choice.
And so it goes for many organizations looking to deploy AI tools. Leaders prioritize their AI projects based on which areas of the business are most important to the bottom line, then embark on a traditional top-down implementation. They roll out AI tools in those chosen areas, expecting employees to use them and hoping for productivity gains.
For example, let’s say a firm determines that its IT team and sales team are the biggest contributors to the bottom line. Thinking top down, it rolls out AI tools for both groups: the IT tool helps increase the pace of coding, while the sales tool automates prospect followup.
Three months in, the IT tool has been widely adopted and productivity increases are measurable. But the sales tool hasn’t budged results.
This approach to AI implementation isn’t scalable. To enjoy the benefits of AI across an organization, leaders need a way to know in advance why one AI implementation will work and another won’t. The answer lies in user data.
Focus on User Data for a User-Driven Transformation Like AI
Unlike many other digital transformations, AI is entirely user-driven. An AI tool that isn’t designed or deployed to make a real difference for employees is one they won’t use. This is why a traditional top-down rollout doesn’t work for AI.
To know where to deploy AI tools, you need to first understand employee pain points – the issues they’re having in their day-to-day work that you’re trying to solve. Without this information, you’ll never know which areas are most in need of AI.
In the example above, the organization took the seemingly logical approach of focusing its AI efforts on two sets of employees who do work that is important to its bottom line. But while the AI tool for the developers happened to address specific, observable work issues, the tool for the sales employees did not and so they didn’t adopt it.
Use Work Friction Data to Prioritize AI Projects
The purpose of AI is to smooth out problem areas, remove obstacles, and accelerate work for employees. In other words, to remove work friction. That’s why you can’t know the right places to use AI if you don’t know where work friction exists.
Many organizations try to identify employee pain points with traditional data-gathering methods, such as surveys, focus groups, and NPS evaluations. But these methods don’t dig deep enough and can’t be easily scaled.
Work friction data, on the other hand, measures hyper-specific moments of work – like retrieving an answer from the codebase or updating information in a prospect’s file – to find friction points. And it does this in a scalable way so company leaders can see where the biggest employee pain points are.
By identifying specific employee pain points, work friction data can help identify the most promising AI use cases. As an AI rollout gets underway, work friction data can also help determine where to make tweaks or adjustments if things are not going according to plan.
In the above example, work friction data could have provided insight on things that were bogging down the firm’s general business employees, such as too much time switching between email and a CRM. With this more granular information, the firm could have opted for an AI tool that specifically helped with integrating the two systems – something these employees would likely welcome.
Don’t Leave Your AI Investments to Chance
Studies have shown that Gen AI projects can boost productivity by anywhere from 13.8 percent to 126 percent. Those are the kinds of numbers that will make any organization sit up and take notice. But even if you know your organization needs to somehow use AI, you may not know exactly where to start.
Like any other big decision, the more information you have to work with, the better your odds of success. And with a user-driven technology like AI, that means having good user data.
By getting to the heart of your employees’ needs and pain points, work friction data can help you determine where and how to best deploy AI. And with that finer-tuned sense of direction, you’ll be much more likely to see the productivity gains and ROI you’re hoping for.
Trying to decide which AI projects are right for your organization? We can help.
Nobody Wants to (Measure) Work Anymore: The Real Problem with AI Transformations
While the growth of AI continues apace, so too does the technology’s ability to confound many organizations. To wit: Forbes projects an annual growth rate of nearly 40 percent in AI over the next six years, but 60 percent of leaders worry they lack a plan and vision to implement it in their companies. That’s called a disconnect.
It doesn’t help that AI transformations are notoriously difficult, as evidenced by their high rate of failure. These are complicated implementations, of course, that come with a lot of questions for the organizations pursuing them: Where should we deploy AI? Which tools make sense? How will we measure success?
But it’s not necessarily the cost or the complexity of the technology itself that’s to blame for so many AI flameouts. The culprit is often the fact that measuring the success of an AI project means measuring work.
It’s simple, really – the goal of AI is to increase productivity and efficiency. And the basis of both productivity and efficiency is work. But most organizations don’t measure how the work their employees are doing is getting done.
In this piece, we’ll explain why it’s so crucial to measure work – especially when it comes time to deploy AI. Just as importantly, we’ll show you the right way to go about it.
Traditional Work Measurement Tools Aren’t Enough
Many organizations don’t measure the work their employees are doing on a day-to-day basis.
Engagement surveys, for example, can be great for determining how employees feel about their work. That’s good feedback to have! But they don’t provide a detailed understanding of how that work actually gets done or where problems tend to arise.
Similarly, process mining can be effective at uncovering operational inefficiencies in an organization. But it doesn’t provide information about, say, the ease of getting manager approvals or whether headsets are generally working. It doesn’t offer any insight into the employee perspective as to whether a proposed solution might actually solve the issues at hand.
In other words, engagement surveys and process mining both have their uses. But for something that requires a deep understanding of how work gets done – such as determining where to most effectively deploy an AI tool – you need to go further.
Measuring Work Means Examining Employee Touchpoints
In most instances, the purpose of AI is to increase productivity by removing obstacles and accelerating work. AI is meant to be a problem-solver, which is why you need to know what problem you want the technology to solve before you choose a tool or make an investment.
This is why measuring work is such an important step in any AI project. Only by understanding exactly where employees are experiencing work friction – the day-to-day pain points that hinder their productivity – can you begin to understand how AI can help.
FOUNT does this by surveying workers about individual moments in their days (that is, specific tasks they complete) and specific touchpoints involved in those moments (including people, processes, and technology involved in completing a task).
We ask about the impact of various moments and touchpoints, as well as workers’ satisfaction with each. When we find areas with high impact and low satisfaction, we know we’ve hit on work friction. To date, we’ve identified more than 8.5 million friction points for our clients.
Understanding where the friction lies in your organization is powerful because friction points are where AI tends to be most effective. For example, work friction analysis could pinpoint a moment in a development workflow – say, reviewing pull requests – where team members could use an AI tool to complete their work more quickly. No more guesswork.
AI Success Depends on Employee Buy-in
When you’ve identified high-friction work moments that AI can improve, you’re well on your way to adopting AI in an ROI-positive way. But it’s important to note that you can’t just take your work friction data and proceed with AI as if it were any other digital transformation.
AI transformations instead require a bottom-up approach. Employees must see the value of the tool for themselves in their work and therefore willingly adopt and use it.
So getting employee input shouldn’t be a one-and-done proposition. Survey them to identify initial friction points, then survey them to identify friction points after the initial implementation. Adjust settings, tweak workflows, and otherwise do what’s needed to make work work.
Efficiency and productivity are important metrics to track for board meetings, of course, but they’re lagging indicators. If you want those metrics to improve from one quarter to the next, it’s essential to measure work in the interim and address the areas preventing improvements – whether or not the fixes involve AI.
With AI, Measure Once, Then Cut
The continued growth of AI demands organizations to be ready and able to take advantage of the opportunities the technology affords – or risk falling behind. Having the information you need to make confident decisions about how and where to deploy is a good place to start.
AI may be high-tech, after all, but its success or failure in an organization tends to be rooted in the spirit of an age-old construction axiom: Measure twice, cut once. And when it comes to AI, even one measurement is better than nothing before jumping in with a big investment.
The key is to make sure you’re measuring the right things – not just how your employees feel about their work, but how they actually do their work. A deep understanding of the latter will show you how and where AI can be most effective. We can help show you how.
APRIL Newsletter. Friction: You Can’t Improve What You Can’t See
The pace and intensity of enterprise transformation efforts have increased as organizations look for ways to grow and get more done – without constantly increasing headcount. Not surprisingly, they’re turning to tech, with 63 percent of CFOs looking to boost IT or digital transformation spending as a way to increase efficiency.
One thing not many are doing as part of these efforts, however, is measuring the impact of that technology on work. Adding new tech without addressing the underlying processes that may already cause friction* not only won’t improve friction, it might create more.
*Friction = is what slows work down – the inefficiencies, blockers, and extra steps workers face when using enterprise systems and processes to get things done.
NEWS
FOUNT Spotlighted by Comcast NBCUniversal LIFT Labs
Number of the Month

FOUNT in Action: Support a Smooth Merger with Pre- and Post-Integration Benchmarking
Industry: Semiconductor & Software
Problem: A large technology company was preparing for a major acquisition. While both companies had solid internal processes, leadership wanted a way to ensure the integration didn’t introduce new inefficiencies in workflows or degrade the employee experience.
Action: FOUNT helped the company establish pre-merger benchmarks across key moments of work, allowing leadership to quantify what was working well and what needed revisions. Post-merger, a follow-up measurement was planned to assess how the integration was going.
Result: Early signs of friction (e.g., unclear equipment request workflows, fragmented knowledge hubs) were flagged, giving teams a chance to fix them before they became systemic. The transformation is an ongoing, multi-year project. We will assess benchmarks in a dozen focus areas throughout the process.
Product Feature: Get Insights from External Tools Faster Than Ever
When you next log in to FOUNT, you’ll find that you can do a direct data upload from third-party survey tools like Medallia , Qualtrics , and LimeSurvey GmbH. This automated upload makes it much easier to go from import to insight.
It also brings users of third-party survey tools one step closer to the real-time data visualization you get when you use FOUNT’s own survey tool.
Bottom line: You’ll save time, reduce errors, and get to the insights your employee data reveals faster.

Most Recent Blog Posts
5 Friction Trends for 2025
- Organizations are undertaking digital transformations to increase productivity, but expected gains aren’t there. The reason? Friction.
- Because the new tech is meant to improve work, it’s important to understand exactly how work gets done.
- Most organizations aren’t measuring the right things, which is why friction is stalling or upending their transformation efforts.
💻Spot the trends in your org
Build vs. Buy: 6 Questions to Ask Before You Try to DIY Friction Measurement
- What is your survey tool designed to do?
- Does your survey data highlight targeted improvement opportunities?
- Will your system scale?
- Where will you get your survey questions?
- What will your time to value be?
- What will your maintenance costs be?
🧰 Get the full breakdown
Process mining vs. employee engagement vs. friction data
You can’t improve what you can’t see, and you can’t see what you don’t measure. This article explains how three types of metrics can provide a better picture of what’s happening in an organization:
- Process mining tracks everything digital.
- Employee engagement tracks how workers feel about their work.
- Friction data tracks obstacles to getting work done.
Friction data complements the other two by illuminating exactly where problems exist so you can focus on fixing the right thing.
📚 Read Artice
Articles We Recommend
📖 Employees Won’t Trust AI if They Don’t Trust Their Leaders
Even as AI adoption increases, employee trust in the tech is falling. Leaders who recognize the value in AI can reverse the trend by ensuring it’s trustworthy. That means taking pains to make sure its outputs are accurate and reliable. Also important: you can’t outsource genuine care to a robot. For best results, leaders need to keep the work of empathy firmly in their realm.
📖 Future of Work Trends 2025: Strategic Insights for CHROs
A refreshingly clear-eyed look at AI, the potential impacts of losing expertise to retirement, and how loneliness might become a business liability. We found #7 particularly intriguing:

Until next time,
FOUNT Global team

Work Friction Research Roundup: What It’s Costing Your Organization
You recognize the impact that identifying and eliminating work friction can have on your organization: increasing productivity, reducing wasteful spend, ensuring big investments pay off. But you need to get buy-in from other stakeholders.
If that’s your situation, this post is for you. In it, we round up the best data on the high cost of work friction and what organizations stand to gain by measuring and eliminating it. All sources are cited so you can build an ironclad case for your cause.
1. 2/3 of Employees Waste 2 Hours Per Day
Summary: This study is a classic in the world of work friction data. Gartner published research in 2020 showing that employees spend two hours per day trying to “hack” their way around various work obstacles – from communication problems to inefficient processes to misaligned technology.
For a 10,000-person organization, the losses balloon:
- 3.1 million hours of wasted time in a year
- $78.4 million in wasted effort
The Takeaway: Work friction is widespread but it can’t be eliminated with sweeping big-picture changes. To cut waste, you have to scale small waste reductions.
Dig Deeper: Gartner issued new guidelines in 2024 about how organization design can impact work friction.
2. $228 – $355 Million / Year in Lost Productivity
Summary: When it’s hard to do a job, employees tend to disengage and become less productive. Eventually, they may leave. Unchecked, employee disengagement and attrition could cost a median-size S&P 500 company from $228 to $355 million in lost productivity, according to McKinsey.
The Takeaway: Less work friction = higher engagement. By identifying and understanding where your employees are having issues – and which issues are costing you the most – you’ll have a roadmap for how to address them.
Dig Deeper: What does that kind of lost productivity look like in the context of your day-to-day business? Just for instance, that $228 million (as a reminder, the low end) could pay the salaries of more than 1,700 new software developers – imagine how that would impact productivity.
3. 70% of Digital Transformation Projects Fail
Summary: McKinsey again, with the oft-quoted finding that some 70 percent of digital transformations fail. Among the most common reasons for such an abysmal success rate:
- Lack of employee buy-in
- Low adoption rates
- Lack of engagement
The Takeaway: Want to make your current effort one of the 30 percent that succeed? Work friction data helps uncover the obstacles and pain points that may be causing employees to resist a digital transformation project.
Dig Deeper: The key is to not wait around until your digital transformation project is already off the rails. Focus instead on early assessment to find things that can be adjusted or realigned – a cheaper and far less disruptive alternative to scrapping a project entirely.
4. 60% of Leaders Worry Their Organization Lacks a Plan and Vision to Implement AI
Summary: AI progress is stalling in many companies, according to Microsoft. While almost 80 percent of leaders agree their company needs to adopt AI to stay competitive, 59 percent don’t think they’ll be able to quantify the technology’s productivity gains. The result? Paralysis.
The Takeaway: Determining where (and where not) to deploy AI to its greatest possible effect requires actionable data. Who is going to use these tools? What problems will AI solve for them? Get to the root of work friction to help answer these questions and ensure you’re setting your organization up for AI success.
Dig Deeper: Your employees could probably benefit from AI. Microsoft’s research also shows that workers are struggling with the pace and volume of their work, and are getting bogged down with mundane tasks (like email). And many are taking matters into their own hands, with 78 percent of AI users bringing their own AI tools to work – a data security and privacy nightmare.
5. Gen AI’s Impact on Productivity Is Entirely Situation Dependent
Summary: Gen AI projects are notoriously difficult to get right, and prevailing research sometimes just muddles things further, to wit:
- Productivity gains ranging from 13.8 percent to 126 percent have been found from Gen AI projects. In general, less experienced workers tend to benefit most.
- Less-experienced call center employees increased productivity by 35 percent with the help of Gen AI tools in one MIT Sloan study.
- On the other hand, junior software developers at a client we worked with were the ones who saw the smallest productivity gains from Gen AI tools.
The Takeaway: The effectiveness of any Gen AI solution is extremely situation-dependent – the key is to really understand your employees’ work and then determine how a new tool might help (or not). Work friction data can help match employee needs with your AI rollout for a greater chance of success.
Dig Deeper: Because it’s still a relatively new area, generative AI implementations require a custom approach. If you’re testing Gen AI tools, assess performance early and often so you can adjust as needed.
Put Work Friction Data to Work for Your Organization
While this research is great for spotlighting the problems associated with work friction – and for giving your key decision-makers some meaningful numbers to consider – it doesn’t provide any actual prescriptive steps to take. To go from best practices to solutions that address the specific problems happening in your organization, you have to actually measure work friction.
With the insights that work friction data provides; you’ll be able to develop the kinds of fixes that can result in the productivity increases and cost savings that your organization craves. Start by digging deeper into some of these numbers, and when you’re ready to make a move, get in touch or book a demo.
.svg)
Don't miss our latest content
Subscribe to our monthly newsletter


.svg)
.svg)